
Compare Power BI Desktop and the Power BI service

 Power BI Desktop is a free application that you download and install on your local computer. Desktop is a complete data analysis and report creation tool that is used to connect to, transform, visualize, and analyze your data. It includes the Query Editor, in which you can connect to many different sources of data, and combine them (often called modeling) into a data model. Then you design a report based on that data model. Reports can be shared with others directly or by publishing to the Power BI service. Sharing reports requires a Power BI Pro license. The Power BI Desktop getting started guide walks through the process.

The Power BI service is a cloud-based service, or software as a service (SaaS). It supports report editing and collaboration for teams and organizations. You can connect to data sources in the Power BI service, too, but modeling is limited. The Power BI service is used to do things such as creating dashboards, creating and sharing apps, and analyzing and exploring your data to uncover business insights. What is the Power BI service details many of the capabilities of the Power BI service. Your license determines what you can do in the Power BI service. For more information about licenses, see Power BI licenses and subscriptions.

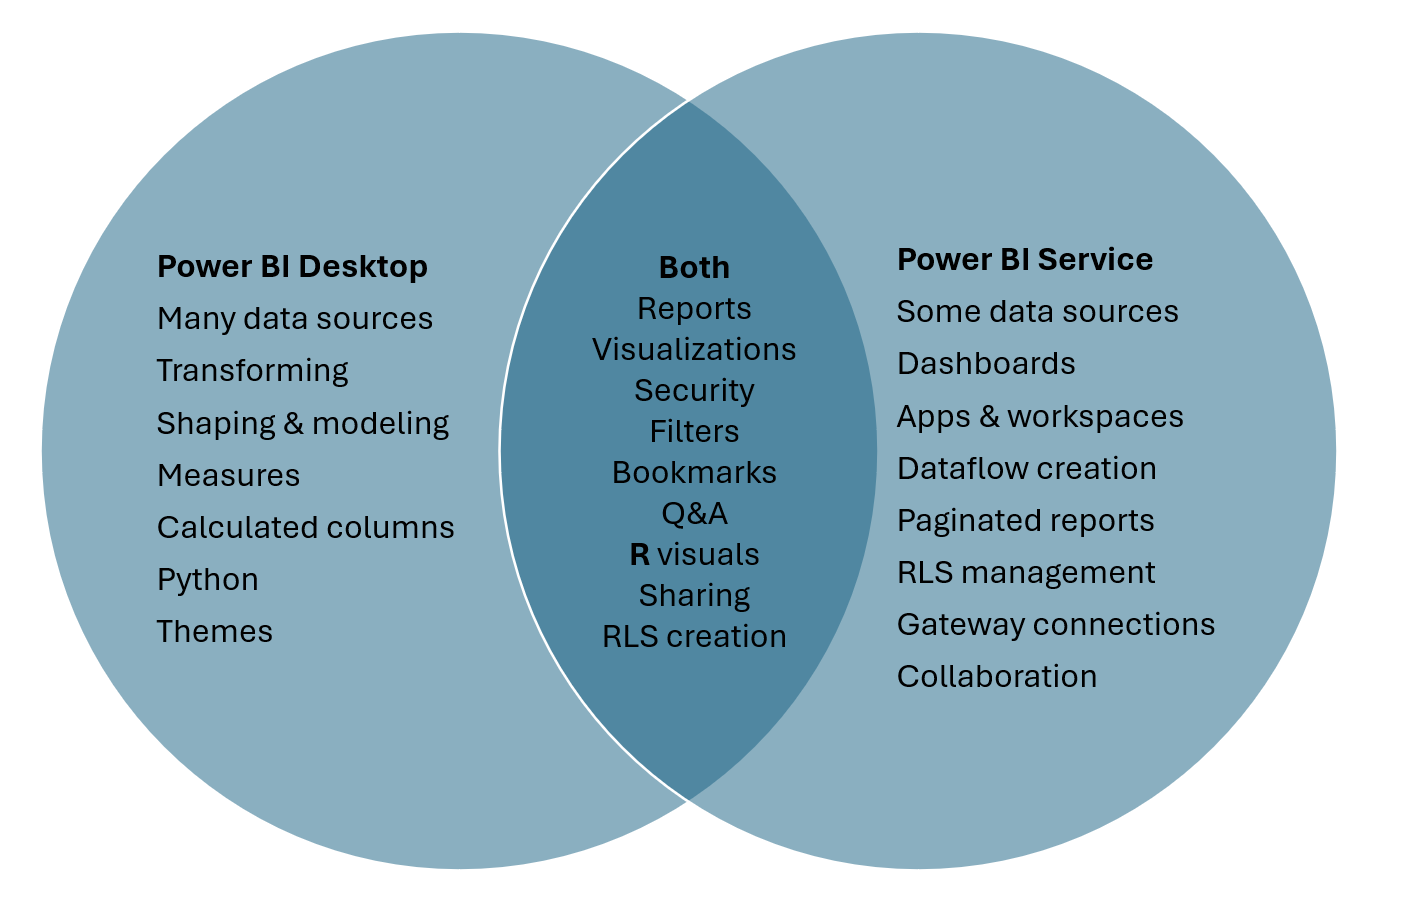
The following Venn diagram compares Power BI Desktop and the Power BI service. The middle shows some of the areas where they overlap. Some tasks you can do in either Power BI Desktop or the service. The two outer sides of the Venn diagram show the features that are unique to either the Desktop application or to the Power BI service.

Venn diagram showing the relationship between Power BI Desktop and the Power BI service.


Comments

Popular posts from this blog

Getting started with Power BI

Getting started with Power BI Find insights in your data and share rich analytics reports. Begin your Power BI free trial within Microsoft Fabric and experience the next generation of data analytics. Try for free   What you can do with Power BI Discover relevant reports Sign up for Power BI  to find relevant content—including reports you built and pre-existing reports from your organization and others. Learn how Uncover report insights Explore your reports to find and generate the  quick insights  you need for better business decisions. Learn how Share insights Collaborate on reports with colleagues, then easily share reports and insights in workspaces, on the web, in apps, via Microsoft Teams. Learn how Connect to data Easily import your data from wherever it is—Excel workbooks, local databases, or the cloud—and transform it so it’s ready to analyze. Learn how Build a report Create and format visuals that present your data story in compelling and insightful ways usi...

View content in the Power BI service

  View content in the Power BI service Completed In Power BI, the term  content  refers to apps, dashboards, and reports. Content is created by Power BI designers, who share it with colleagues like you. Your content is accessible and viewable in Power BI, and the best place to start is your Home canvas. Explore Power BI Home When you sign in, Power BI opens and displays your Home canvas. Power BI Home offers three ways of locating and viewing your content. Though all three access the same pool of content, they're merely different ways of getting to that content. Occasionally, searching is the easiest and quickest way to find something. Other times, selecting a tile on the Home canvas is your best option. The Home canvas displays and organizes your favorite and most recent content, along with recommended content and learning resources. Each piece of content displays as a tile, with a title and icon. Selecting a tile opens that content. The global search box lets you search...