View content in the Power BI service
In Power BI, the term content refers to apps, dashboards, and reports. Content is created by Power BI designers, who share it with colleagues like you. Your content is accessible and viewable in Power BI, and the best place to start is your Home canvas.
Explore Power BI Home
When you sign in, Power BI opens and displays your Home canvas.
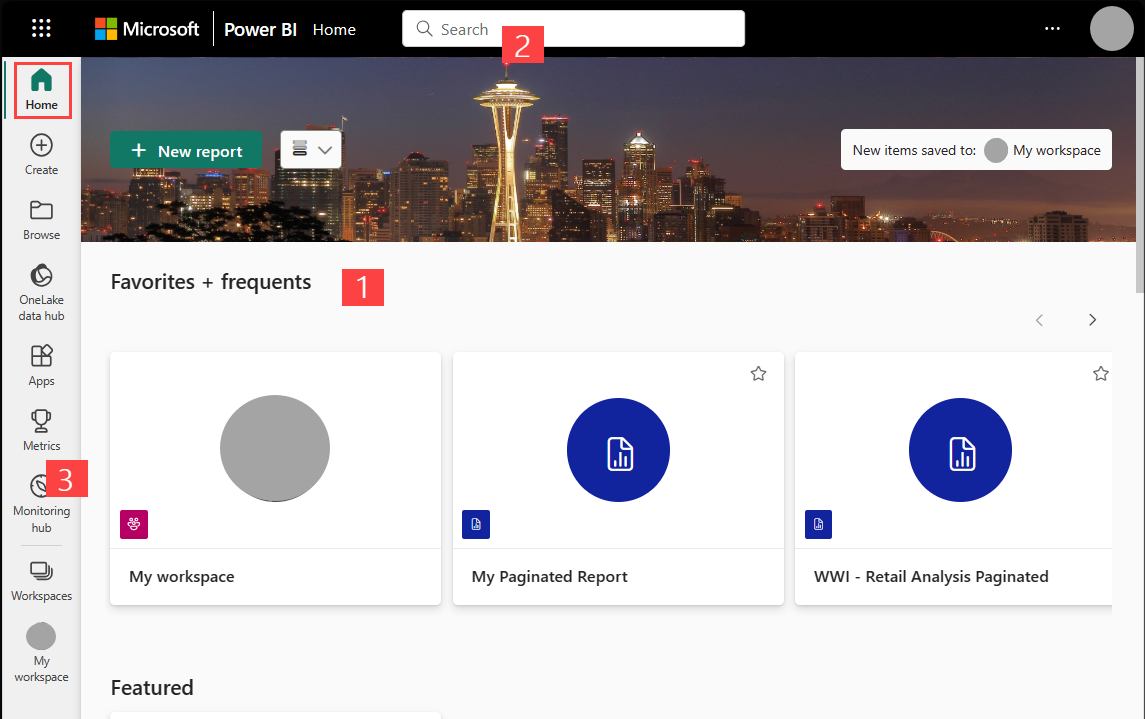
Power BI Home offers three ways of locating and viewing your content. Though all three access the same pool of content, they're merely different ways of getting to that content. Occasionally, searching is the easiest and quickest way to find something. Other times, selecting a tile on the Home canvas is your best option.
The Home canvas displays and organizes your favorite and most recent content, along with recommended content and learning resources. Each piece of content displays as a tile, with a title and icon. Selecting a tile opens that content.
The global search box lets you search for content by title, name, or keyword.
On the side navigation pane, you can view lists of content and select the one to open.
The following sections review each of these options for finding and viewing content.
Home canvas
On the Home canvas, you can view all the content that you have permission to use. At first, you might not have much content, but that changes as you start to use Power BI with your colleagues.
Your Home canvas also updates with recommended content and learning resources. As you work in Power BI, you receive dashboards, reports, and apps from colleagues, and your Home canvas eventually fills in.
The next few sections take a closer look at the Home canvas, from top to bottom.
Key metrics at a glance
As previously mentioned, on your Home canvas, you can view all the content that you have permission to use. Each piece of content is a tile, and selecting a tile takes you to that piece of content. For example, selecting a tile for a dashboard opens the dashboard.
Most important content at your fingertips
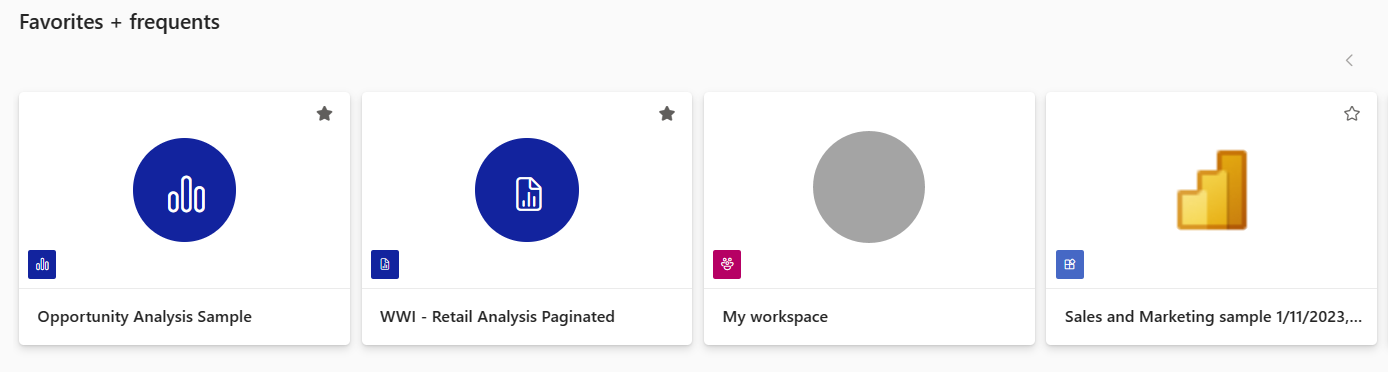
Favorites and frequents
This top section contains links to the content you visit most often or that you’ve tagged as a favorite. Notice that some tiles have stars to indicate they've been tagged as favorites.
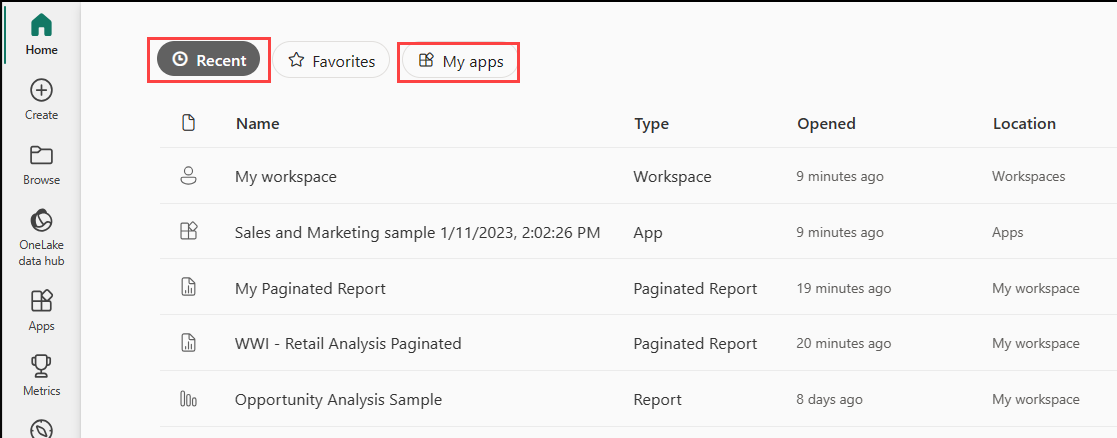
Recent and My apps
The next section displays the content you've visited most recently. Notice the timestamp on each tile. The My apps section lists apps that have been shared with you; the most recent apps are listed here.
Featured apps
Power BI displays a set of featured apps. Selecting an app tile opens the app.
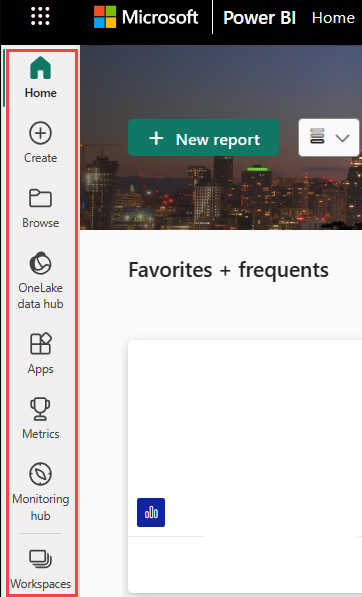
Explore the navigation pane
Use the navigation pane to locate and move between dashboards, reports, and apps. Occasionally, using the navigation pane is the quickest way to get to content.
The nav pane is there when you open Home, and remains static as you open other areas of Power BI.
The nav pane organizes your content into categories that are similar to what you’ve already seen on the Home canvas. To open one of these content sections and display a list of all items, select the heading.
Search all of your content
Sometimes, the fastest way to find your content is to search for it. Perhaps you’ve discovered a dashboard you haven’t used in a while isn’t showing up on your Home canvas. You remember that your colleague shared it with you but you don’t remember what he called it or whether it was a report or a dashboard.

You can enter the full or partial name of that dashboard and search for it. Additionally, you can enter your colleague’s name and search for content that they've shared with you. The search is scoped to look for matches in all the content that you own or have access to.
Comments
Post a Comment